

Key Events: Hostilities with Iran on the rise again
Tensions with Iran mounted throughout the week after Iran damaged several ships in the Strait of Hormuz. As the week ended, President Trump exclaimed the “the ceasefire is over” Friday on social media.1 Oil prices rose nearly $3 dollars for the week as WTI closed above $71 on Friday2.
Markets digested the news of rising geopolitical risk reasonably well considering it marks the end of a fragile ceasefire.
Market review: Large caps rise along with bond yields
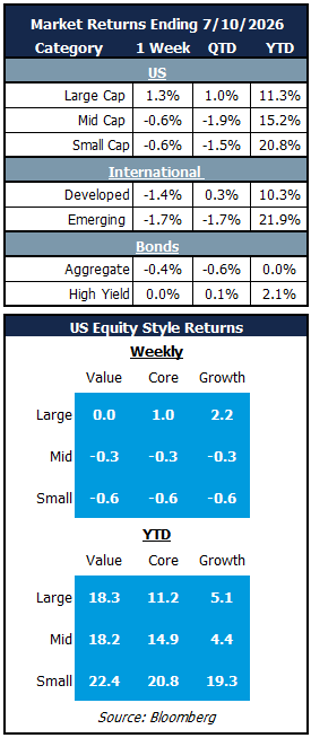
The S&P 500 gained 1.3%, while small and mid-cap stocks each fell 0.6%. Large-cap growth led the modest advance in U.S. large-cap equities, while developed international and emerging markets each declined by more than 1%.
The 10-year treasury yield rose by nearly 8 basis points last week, delivering a setback to the aggregate bond market. Elevated concerns about inflation and renewed hostilities in the Strait of Hormuz have pushed up the odds of a potential rate hike.3
Outlook: Second quarter earnings take the stage
Quarterly releases get underway in the week ahead with money center banks taking the lead, followed by large industrial and healthcare companies. S&P 500 earnings are anticipated to be strong for Q2 as estimates have been revised steadily higher throughout 2026. Earnings expectations have increased by more than 10% this year with roughly 60% of that increase coming in the second quarter alone4.
Current estimates put full year earnings near $344 a share, implying a growth exceeding 23%, well above the S&P 500’s historical long-term earnings growth rate of 6% to 8%5. Capital expenditures tied to the AI buildout have been a primary drivers of the increase. Supply and demand imbalances in certain areas of the semiconductor complex have given data center suppliers extraordinary pricing power and profit margins have accelerated on both rising volume and surging prices.
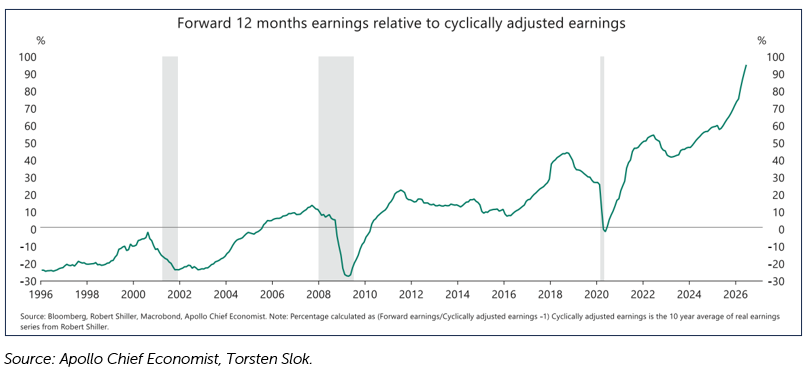
This dynamic has weighed heavily on the overall market as shown in the chart below from Apollo. Earnings acceleration has driven forward earnings assumptions to levels well above historical ranges versus cyclically adjusted earnings. While this pace looks unsustainable over an extended period, debate over whether AI-driven growth proves secular rather than cyclical is becoming more prominent.
The debate remains unresolved and may not be fully understood until well after the fact. The best path forward is to manage risk exposure appropriately: adhere to portfolio objectives and maintain diversification across geography, market cap, sector and style.
Gap Between Forward and Trailing Earnings Is Extended
OneAscent Navigator Outlook: July 2026
This material is intended to be educational in nature, and not as a recommendation of any particular strategy, approach, product or concept for any particular advisor or client. These materials are not intended as any form of substitute for individualized investment advice. The discussion is general in nature, and therefore not intended to recommend or endorse any asset class, security, or technical aspect of any security for the purpose of allowing a reader to use the approach on their own. Before participating in any investment program or making any investment, clients as well as all other readers are encouraged to consult with their own professional advisers, including investment advisers and tax advisors. OneAscent can assist in determining a suitable investment approach for a given individual, which may or may not closely resemble the strategies outlined herein.6
1) Source: Bloomberg news story from Bloomberg S&P 500 Week in Review dated 7/10/2026.
2) Source: Bloomberg data.
3) Source: Bloomberg data from Bloomberg World Interest Rate Probabilities (WIRP) function.
4) Source: Bloomberg earnings estimates data.
5) Source: Historical earnings growth rates for the S&P 500 vary from peak to peak and trough to trough measurement periods. The range of 6% to 8% covers most extended measurement periods in stock market history and is cited by the data service provider FactSet as an appropriate range.
6) Market Returns reference the following indices: Large Cap – S&P 500, Mid Cap Growth – Russell Midcap growth, Mid Cap Value – Russell Midcap Value, Small Cap – Russell 2000, Developed – MSCI EAFE, Emerging – MSCI Emerging Markets, Aggregate – Bloomberg US Aggregate, High Yield – Bloomberg High Yield