

Key Events: Softer data eases concerns for the Fed
Headline CPI data for July rose by 0.1% month on month while the core measure rose 0.2%. The annual measures for each backed off by 0.1%, respectively. These were in line with expectations. The producer price (PPI) data came in flat with the core up 0.2%, but better than feared. Retail sales fell 0.6% for the month coming in well below expectations.1 Each of these data points provided some relief for the Fed.
Market review: Equity markets advance and broaden
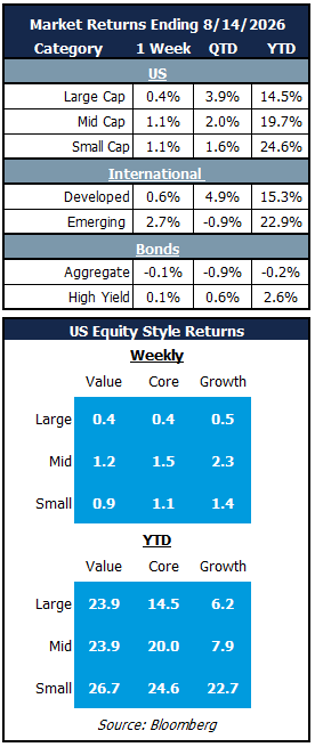
Global equity markets continued to march forward following last week’s large cap surge. Performance broadened as small and mid-cap stocks bested large caps and emerging markets delivered the strongest returns for the week.2 Bonds were mixed as rates edged higher for the week, while the market scaled back expectations for a rate hike through year end.
Outlook: Exuberant earnings revisions set to slow
Rising interest rates, inflation pressures emanating from higher energy prices, geopolitical risk and remarkable AI capex, and economic data indicating challenges (retail sales, credit delinquencies, consumer sentiment, etc.) imply significant uncertainty for markets. Yet, corporate profits remain the most important driver of equity returns, and the current earnings revisions cycle is now unmatched outside of recession recovery periods.
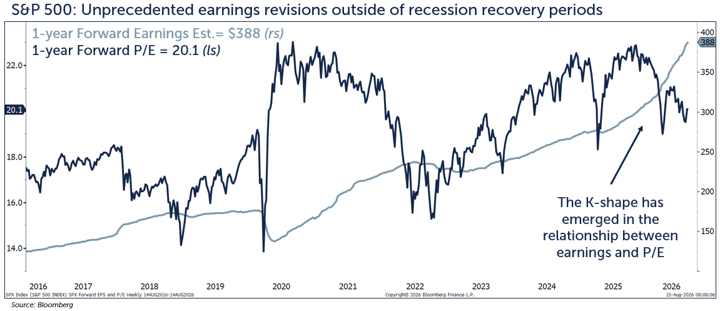
As shown in the chart below, forward earnings estimates have surged throughout 2026. Stunning earnings results in the first two quarters of the year have sparked a 30% increase in forward earnings. Profit margins are now at record highs and the journey to this point has been wonderful news for those with significant equity exposure. However, the profit share of national income sits at a 75-year high, while the wage share sits near a 75-year low.3 A balanced and healthy advance should allow for some progress to accrue to the labor market and further profit margin expansion looks unlikely. For now, capital continues to substitute for labor and the promise of productivity through AI capex is driving equity markets higher.
While profit margins may be nearing a peak and the macroeconomic backdrop offers plenty of uncertainty, the recent valuation reset offers support for markets. The forward P/E ratio for the S&P 500 has contracted by more than 12% over the last 10 months suggesting that the market has already discounted higher rates and an eventual slowing in the earnings outlook. The K-shape has clearly become evident not only in the relationship between profit margins and labor, but also between earnings estimates and forward P/E ratios.
AI capex and the corporate profit cycle remain the key drivers for markets, but the benefits have broadened and we continue to counsel advisors to embrace diversification across geography, market capitalization, style, sector and asset class.
OneAscent Navigator Outlook: August 2026
This material is intended to be educational in nature, and not as a recommendation of any particular strategy, approach, product or concept for any particular advisor or client. These materials are not intended as any form of substitute for individualized investment advice. The discussion is general in nature, and therefore not intended to recommend or endorse any asset class, security, or technical aspect of any security for the purpose of allowing a reader to use the approach on their own. Before participating in any investment program or making any investment, clients as well as all other readers are encouraged to consult with their own professional advisers, including investment advisers and tax advisors. OneAscent can assist in determining a suitable investment approach for a given individual, which may or may not closely resemble the strategies outlined herein.4
1) Source: Bloomberg data.
2) Source: Bloomberg data.
3) Source: Linked-in chart from LSEG Datastream via Dhaval Joshi, Global Market Equity Strategist formerly of BCA Research.
4) Market Returns reference the following indices: Large Cap – S&P 500, Mid Cap Growth – Russell Midcap growth, Mid Cap Value – Russell Midcap Value, Small Cap – Russell 2000, Developed – MSCI EAFE, Emerging – MSCI Emerging Markets, Aggregate – Bloomberg US Aggregate, High Yield – Bloomberg High Yield
OAI01603
Written by: Peter Klingelhofer