

AI Dominance: Driving Performance Extremes and Igniting Bubble Debates
As the month of May came to its close, markets were gaining confidence that the U.S. and Iran were getting closer to a deal and oil prices and bond yields were falling as a result. This bolstered enthusiasm for risk assets, but the driving force for strong returns during the month of May were blowout earnings reports from a handful of companies providing components for the AI infrastructure expansion unfolding across the globe.
The S&P 500 advanced by just over 5% with more than the entire contribution to return derived from the information technology sector, indicating that the remaining ten sectors delivered a combined negative return for the month.1 Performance extremes have permeated the markets for some time now, but the current rally has become rather historic. According to an article by Cameron Crise titled “Equities Have Done Things In May We’ve Rarely Seen Before”, May represented the second consecutive month with 5% gains, with both months marking an all-time monthly close. It’s a feat that’s only happened 8 times since 1928 and, not surprisingly, can often occur in recovery from a shock (e.g. – LTCM in 1998, Covid in 2020, and the Iran conflict this year). Other occurrences were in 1997 and 1986, a couple times in the 50’s and leading up to the peak in 1929.2
The key driver for tech sector strength is the capex boom being led by the hyperscalers. The insatiable demand for memory chips (SK Hynix, Micron and Samsung) and servers (represented by Dell) has fostered the parabolic rise of the AI suppliers stock prices as shown in the chart below. SK Hynix, Micron and Samsung all reached the trillion dollar market cap level in May, and the performance of the SOX Index and the Kospi Index (Korean Stock Exchange) has ignited a renewed interest in ‘bubble’ debates.
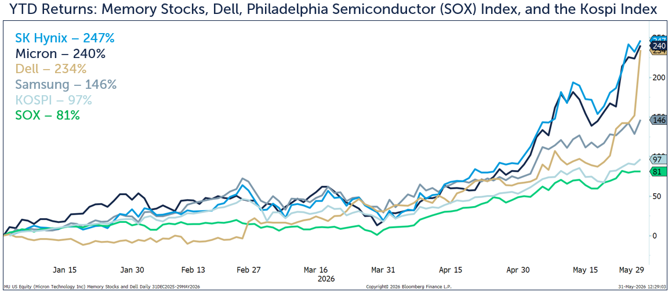
Before we dive into the consequences of the AI boom and the macroeconomic outlook, let’s review how the last month unfolded:
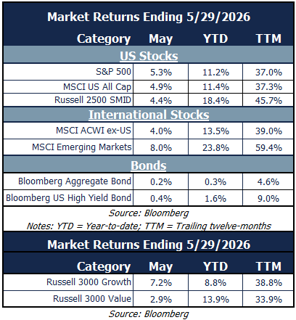
May Market Review
The rally continued last month as robust technology earnings reports boosted expectations:
- Emerging markets led the way due to sensational performance amongst technology stocks, primarily based in South Korea and Taiwan.
- Small and mid-cap stocks lagged large caps. Relative sector and factor composition compared to large cap indices played a major role.
- Momentum, high beta and growth were leading factors, while dividend strategies and value lagged.3
- Bonds showed modest improvement even though yields rose. Falling energy prices and reduced risk concerns regarding the conflict with Iran helped the cause.
Blowout earnings reports from a few notable technology suppliers providing components for the global AI data center expansion eclipsed geopolitical and inflation fears:
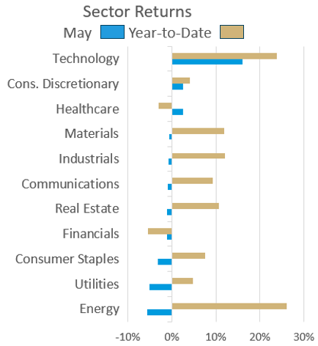
- Technology advanced 16% and drove the S&P 500 to eleven all-time closing highs.4 Dell more than doubled, Micron joined the trillion dollar market cap club, and technology was the lone sector to outperform in May.5
- Consumer discretionary and healthcare were the only other sectors to post positive returns.
- Consumer staples, utilities and energy fared poorly as oil prices fell and investors reduced defensive exposure.
- Materials, industrials, communications, real estate and financials all finished modestly lower (down 1% or less) as investors shifted allocation into momentum, high beta and growth attributes currently reflected by aggressive AI capex plans.
Our Navigator framework informs us of our outlook.
June 2026 Navigator Outlook
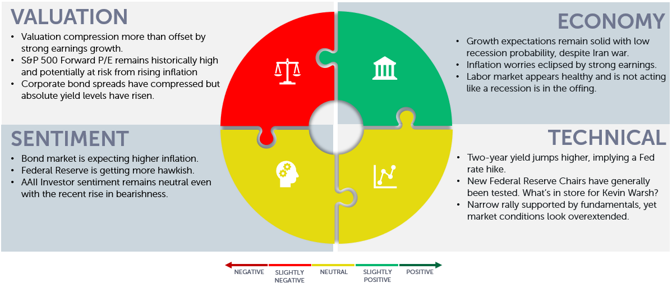
Economy: Growth expectations remain solid with low recession probability, despite Iran war. Inflation worries eclipsed by strong earnings. Labor market appears healthy and is not acting like a recession is in the offing.
Technicals: Two-year yield jumps higher, implying a Fed rate hike. New Federal Reserve Chairs have generally been tested. What could be in store for Kevin Warsh? Narrow rally supported by fundamentals, yet market conditions look overextended.
Sentiment: Bond market is expecting higher inflation. Federal Reserve is getting more hawkish, based on data from Fed meeting minutes. AAII investor sentiment remains neutral even with the recent rise in bearishness.
Valuation: Valuation compression more than offset by strong earnings growth. S&P 500 forward P/E remains historically high and potentially at risk from rising inflation. Corporate bond spreads have compressed but absolute yield levels have risen.
Outlook and Recommendations:
The recent surge in chipmakers has the Philadelphia Semiconductor Index on pace for its best quarter ever and the technology sector has propelled the S&P 500 to its ninth straight weekly gain, matching the longest winning streak since 1985.6 Extreme performance results can resemble a “late-stage speculative bubble” for some observers, while others cite fundamental developments supporting current activity. The current list of positives and negatives includes the following attributes:
Bubble Concerns:
-
High trailing P/E of 26x for the S&P 500
-
Aggressive investor positioning (high equity exposure and high-beta, cyclical tilt)
-
Narrow performance with high concentration
-
Euphoric discussions around large IPO schedule looming (Space, Anthropic, OpenAI)
-
Unsustainable profitability with above-normal earnings growth expectations
- Over-investment leading to excess capacity (capex boom and then bust)
Supporting evidence for current market valuations:
-
Current performance supported by strong earnings
-
AI infrastructure build-out is in early stages and has a long runway
-
Future productivity gains are underestimated
- Future pricing power (higher sustained profitability) of AI winners
The factors mentioned here are specific to the markets current pricing and implied outlook for AI related equities worldwide. This does not include the normal risks associated with traditional economic cycles such as the path of interest rates, inflation, or economic growth, natural competitive forces affecting profitability, labor market conditions, corporate credit conditions, government indebtedness, geopolitical risks, exogenous events, and/or the availability of resources.
Given the impressive fiscal and monetary stimulus over the last several years, the markets have become highly contented with the view that recession probability remains historically low due to the adaptive nature of our advanced domestic economy supported by the breadth and depth of employment in service industries. As a result, the recent ebullience in the market can largely be attributed to the AI earnings developments and the likelihood near-term closure or at least a memorandum of understanding (MOU) with Iran.
When considering the list of bubble concerns, perhaps the most important fundamental development is the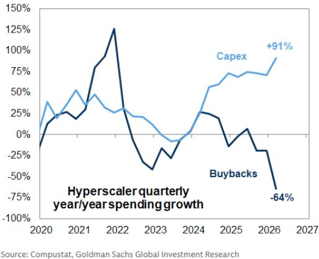 impressive commitment to capex amongst the meg-cap US hyperscalers (Apple, Meta, Google, Amazon, Oracle, et al). They are expected to spend $755 billion in 2026, representing growth of 83%. During Q1, they collectively increased capex by 91% and cut buybacks by 64% as shown in the chart at right.7 The surge in capex is likely to
consume all the cash flow generation for these companies and the forecast for 2027 shows incremental growth. This is an unsustainable situation, but it is the primary source of the incredible earnings growth for semiconductors, server providers, power providers and engineering and construction firms supplying goods and services for AI infrastructure.
While this might suggest there is evidence that we have potentially reached the phase of overinvestment leading to excess, the current earnings results and forecast for the upcoming year are the corollary of hyperscaler capex and showing a sharp acceleration with earnings growth expectations of 22% for the upcoming 12-months.
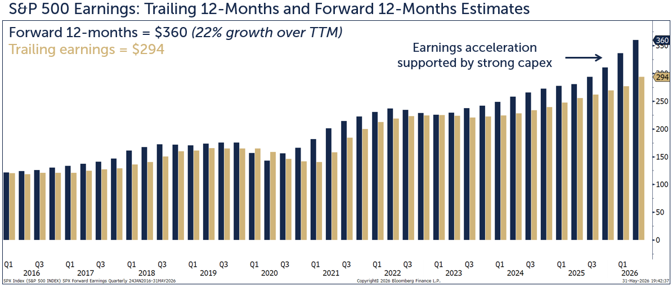
The irony of the current situation is that one of the primary bubble concerns (potential overinvestment) is providing positive support for the case of the optimists (strong earnings growth and above normal profitability for AI infrastructure providers). Until the state of play for the hyperscalers changes or some of these pressures upset the balance between inflation, interest rates and growth, the race to build future AI infrastructure likely continues.
Portfolio Construction and Positioning
While the markets sort out the depth and breadth of AI bubble risks, the macroeconomic backdrop offers additional concerns: elevated commodity prices due to severely reduced Strait of Hormuz tanker traffic, impacts of continued rising inflation and/or weakening economic growth conditions, interest rate policy with a new Fed Chair and upcoming mid-term elections just to name a few. Offsetting the risks are strong and rising corporate profits that have been overwhelming the headline risks since the end of March.
Whether the markets are in a “late-stage speculative bubble” can only be understood with hindsight at some future date. However, maintaining diversification and aligning portfolio risks and objectives remain essential principles to prepare for the risks of a potential unwinding from bubble conditions.
Our Navigator process helps guides both short- and medium-term tactical adjustments:
- Mid-cap and international equities: These segments offer attractive valuations relative to U.S. large caps and provide long-term diversification benefits.
- Balanced exposure across styles: We maintain a mix of growth stocks poised to benefit from technological innovation and value stocks offering upside potential with an emphasis on cash flow and dividends.
- Fixed income remains compelling: Bond yields exceed the earnings yield of large-cap equities, and real (inflation-adjusted) yields are positive—supporting the case for continued fixed income exposure.
- Mortgage-backed securities: We see favorable risk-reward dynamics here, though tight corporate credit spreads warrant caution.
- Alternative investments: We continue to find meaningful opportunities in both non-correlated strategies and private market investments.
Constructing resilient portfolios capable of compounding effectively over time is our primary goal. Our foundation is rooted in discipline and diversification, and we remain mindful of risks to the outlook.
This material is intended to be educational in nature, and not as a recommendation of any particular strategy, approach, product or concept for any particular advisor or client. These materials are not intended as any form of substitute for individualized investment advice. The discussion is general in nature, and therefore not intended to recommend or endorse any asset class, security, or technical aspect of any security for the purpose of allowing a reader to use the approach on their own. Before participating in any investment program or making any investment, clients as well as all other readers are encouraged to consult with their own professional advisers, including investment advisers and tax advisors. OneAscent can assist in determining a suitable investment approach for a given individual, which may or may not closely resemble the strategies outlined herein.8
1) Source: S&P Global, S&P Dow Jones Indices. US Dashboard for May 2026.
2) Source: Bloomberg story: “Equities Have Done Things In May We’ve Rarely Seen Before”, by Cameron Crise, dated 5/29/2026.
3) Source: S&P Global, S&P Dow Jones Indices. US Dashboard for May 2026.
4) Source: S&P Global, S&P Dow Jones Indices. US Dashboard for May 2026.
5) Source: Bloomberg data.
6) Source: Bloomberg story “US Stocks Extend Win Streak on Peace Deal Hopes, AI Excitement” dated 5/29/2026.
7) Source: Goldman Sachs Investment Research via Brian Sozzi, Executive Editor at Yahoo Finance.
8) Source: Market Returns reference the following indices: Large Cap – S&P 500, Mid Cap Growth – Russell Midcap growth, Mid Cap Value – Russell Midcap Value, Small Cap – Russell 2000, Developed – MSCI EAFE, Emerging – MSCI Emerging Markets, Aggregate – Bloomberg US Aggregate, High Yield – Bloomberg High Yield
OAI01540